Sensing the Poles’ Hidden Heat (NASA Image of the Day)
NASA has recently highlighted the project with an Image of the Day article that includes a new animation of two years of seasonal temperature swings in the Arctic and Antarctic regions, as seen by the twin PREFIRE CubeSats!
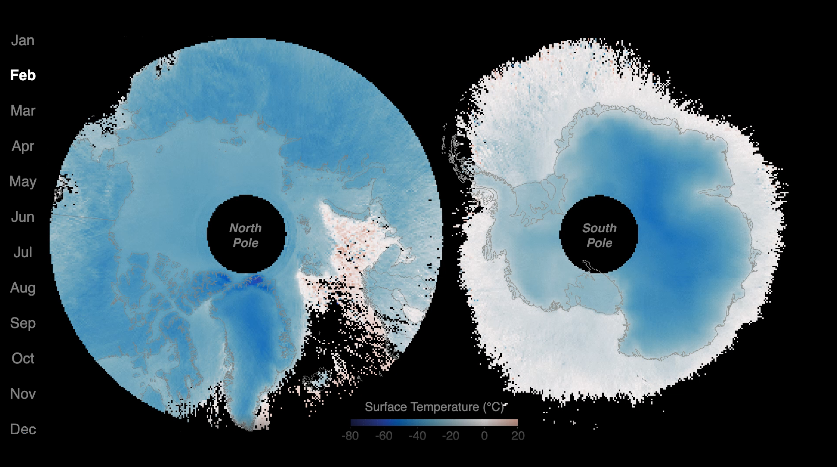
Surface temperature during clear-sky conditions is only one of many measurements that can be derived from PREFIRE’s spectral measurements of the mid- and far-infrared wavelength range. The team is hard at work teasing out details of clouds, water vapor, ice/snow, energy fluxes, and other things from this unique dataset.